Reports
Parks Design for Diverse and Resilient Communities.
A study in collaboration with The Washington State Parks Foundation that paid BIPOC volunteers to visit a state parks and reflect on how parks can better serve under-represented communities.
More
Reflecting on Remote Learning for UW's Board of Regents.
With hybrid options proposed as education returned to campus after the COVID Pandemic, PODUW's report about the student experience through remote learning was discussed by UW's Board of Regents.
More
Consulting on Alternative k-12 Education Opportunities.
Supporting Big Picture Learning's ImBlaze program through working with a team led by their Director of Technology. We analyzed different extensions of the student journey through statistical and NLP methods.
More
Hiking Traffic Trends and Demographic Factors.
An interactive storytelling platform in collaboration with the Outdoor Recreation and Data lab, supporting land managers' expectation of traffic, as well as trail users navigating Washington's trails.
More
CSE Student Internship and Career Plans at UW.
A collaboration between PODUW and the Association for Computing Machinery reflecting on Computer Science students through the internship application and interview processes in the tech industry.
More
Voicing Student Opinions on UW's Diversity Credit.
A report for UW's student government body, ASUW, preceeding a potential change by the unversity for the Diversity credit requirement for graduation.
More
Career Plans for iSchool Students.
With the help of UW's iSchool, PODUW surveyed students on their selected degree tracks and career expectations, and published a report along with a series of interactive visuals.
More
Forecasting Blood Donations at MedTourEasy.
A machine learning approach to predicting blood donations based on donors' histories and tendancies. TPOT's classifier was used to optimize parameters and a Logistic Regression model was implemented.
More
Dashboards
Employer-Student Engagement Dashboards at CFA
A series of dashboards for admin assessment at Computing For All, an education nonprofit, reviewing activity between students and partner employers. The dashboards were also used for grand and donor reporting.
More
Green Seattle's Ecological Restoration Program
A series of dashboards showcasing progress at the City of Seattle's Green Seattle Partnership, which set up volunteer programs around city parks. Dashboards detailing species, locations, and quantities were set up.
More
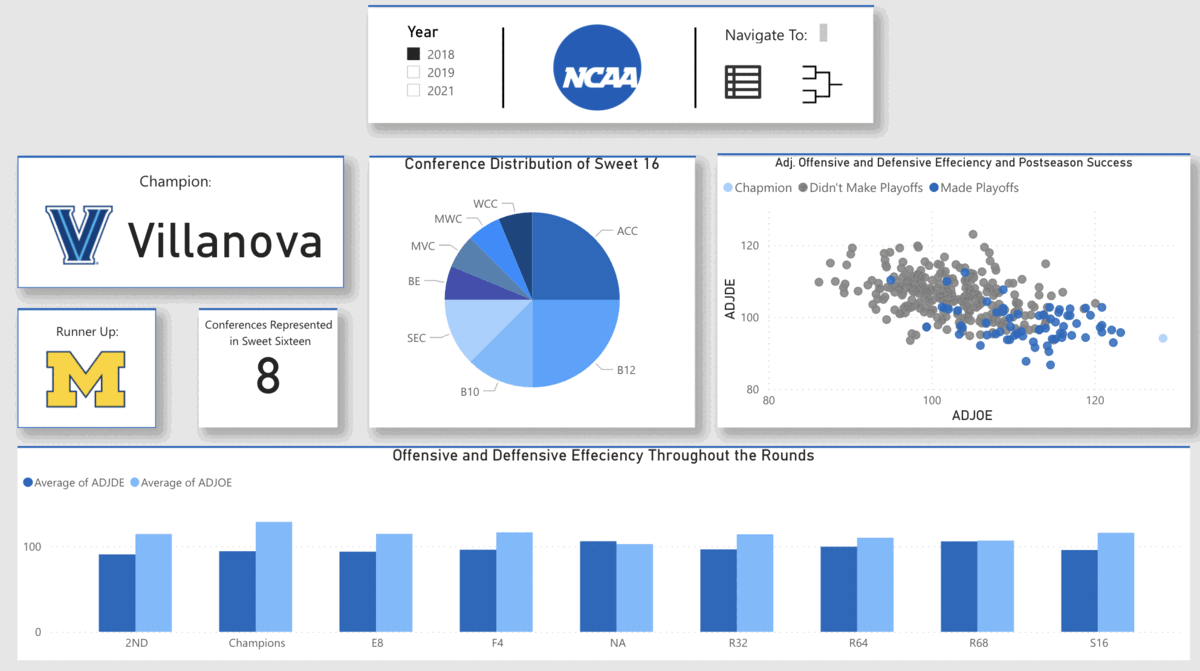
NCAA Basketball Seasonal Review
Dynamic dashboards that review a given season of college-level basketball using official NCAA regular season and playoff data.
More
Miscellaneous
Sympathy for the Devil - Website
A website for the course Sympathy for the Devil Phil-301 at UW, a course that tackles sympathy and its rhetorical uses. The website also showcases published student projects from Winter 2022
More
Racial Disparity Through Effects of the COVID Pandemic
Our 3-person team's submission to Vizathon, a hackathon by the Coronavirus visualization team at Harvard. We analyzed recorded cases and deaths between ethnicities crossed with more socioeconomic data to showcase disparities.
More
Deepfake Cybercrime - My Horrendous Attempt
A storytelling article publishing a project where I testeed deepfake use cases for cybercrime. I trained a deepfake model and used fake videos of myself asking friends for login credentials.
More
PODUW Bot
A slack bot that automated some of the organizational work at PODUW. PODUW Bot was also tasked with the very important mission of robotically announcing events and updates. The satire had mixed recepit..
More
Beat the Blaze Hackathon Submission
Our team's submission at a hackathon set up by the Department of Defense's National Security Innovation Network. We designed a Raspberry Pi based communication system to maximize bandwidth during natural disasters.
More
Sympathy for the Devil - Submission
Another project for UW's Sympathy for the Devil course, this one from the previous year when I took the course, where I desigend an interactive story platform for our group project.
More
Services
Dashboard Design and Development
Understand what data is useful for your administrators and stakeholders to review, and equip them with an effecient preview of important KPIs and other measures of what's happening across your organization.
More
Data Analytics
Extract actionable insights from data through quantitative analysis, costumer segmentation, statsitcal and machine learning methods. Cross-reference your data within and with public data to uncover trends.
More
Data Scraping
Enable your organization through access to online and third party data. Utilize information from social media, reviews, directories, and other sources. Statically or with automation services to dynamically update data.
More
Natural Language Processing (NLP)
Utilize latest methods in machine learning to extract and quantify insights from open ended qualitative and text data. Applicable for survey results, social media data, writing submissions, and more.
More
Storymap Design and Development
Analyze geospatial data within your organization, and cross-reference it with census and public data. Uncover geographical trends, and/or build interactive map narratives with live data.
More
Business Process Automation
Boost your organization's workflow through automating technical logistics and business processes. Automate forms, notifications, reminders, replies, bots, schedule tasks, and more.
More


